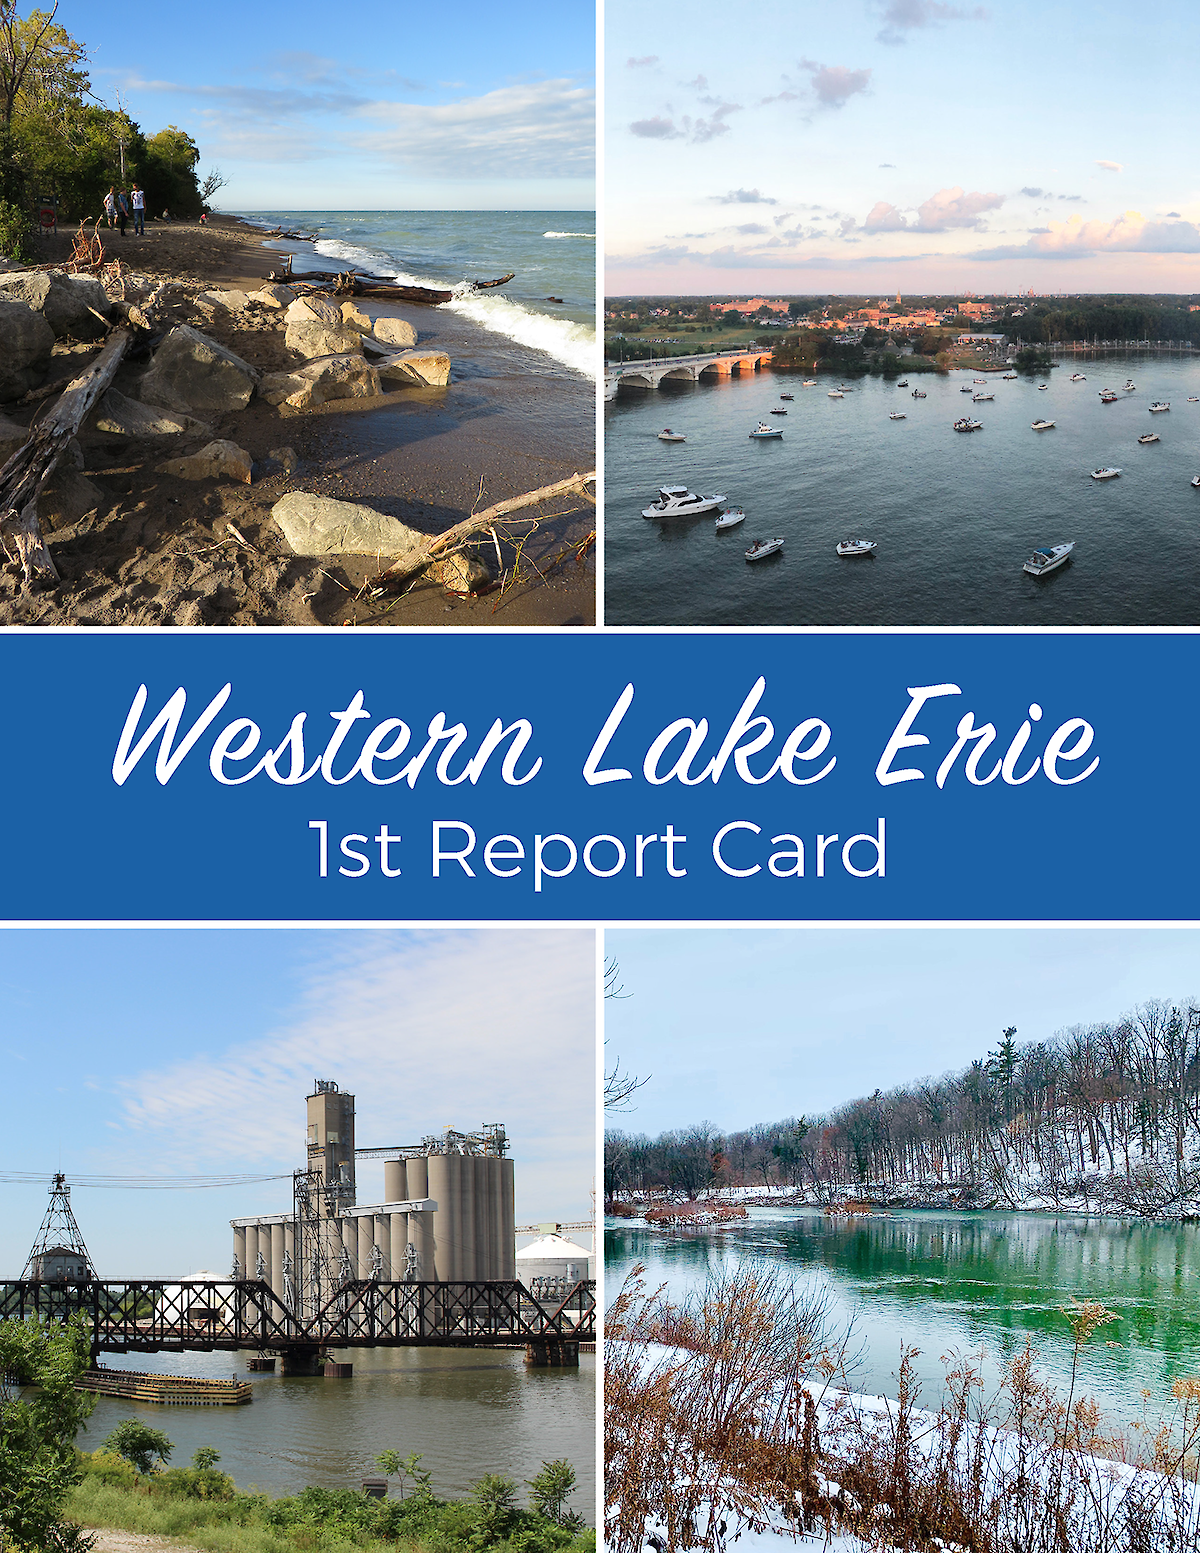
On August 14, 2020, the first-ever Western Lake Erie Report Card was officially released during a virtual webinar event. This is the first report card IAN has done in the Great Lakes region. The project, started in October 2018, is a product of the University of Maryland Center for Environmental Science that was funded by the City of Toledo, Ohio; Lucas County, Ohio; and the City of Oregon, Ohio through the Lake Erie Foundation.


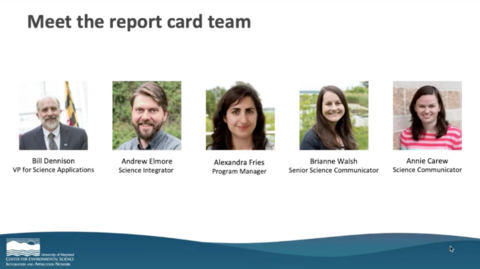
The IAN team that worked on the report card project included Bill Dennison, Andrew Elmore, Brianne Walsh, Annie Carew, and myself. This report card evaluated the Western basin of Lake Erie and its watershed, which includes parts of Ohio, Michigan, Indiana, and Ontario. The analysis of Western Lake Erie lake basin health includes 11 indicators in three categories: water quality, algal blooms, and fish. The analysis of Western Lake Erie watershed health includes 10 indicators in three categories: water quality, toxics, and biology.
The release event was held via Google Meet with a live, virtual audience of over 120 people. Bill Dennison kicked off the webinar, and introduced several local elected officials and scientists from the Lake Erie region, all of whom gave short but impactful speeches regarding the report card.
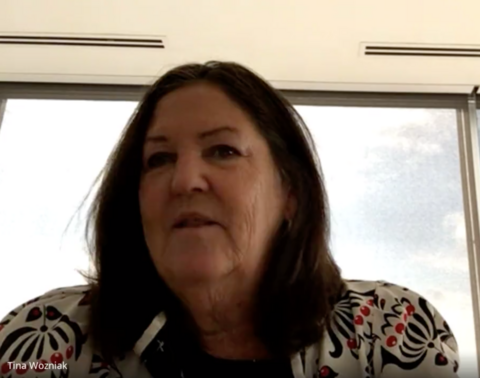
Following Bill's introduction was the first speaker, Tina Skeldon Wozniak, the Lucas County Commissioner. I found a few of her quotes to be really meaningful.
"We continue to fight for meaningful enforcement of the Clean Water Act and meaningful steps toward a basin-wide TMDL. Our citizens expect clean drinking water. They expect to be able to boat, to fish, to have many lake activities including swimming, and having high property values along the lake. And just be a great opportunity for us to live in this region, knowing that we have clean water." —Commissioner Tina Wozniak
"We're thrilled of the development of this critical tool for our region. When we developed the Western Lake Erie nutrient source inventory (NSI), we believe the report card will assist in effectively communicating this information that can be drawn also from the NSI tool and they
can work together so beautifully." —Commissioner Tina Wozniak
"As a lawmaker, I know it is critical to have information and sound science to help us identify
the environmental challenges of our time so we can tackle them together. But I'm one of those
old-fashioned people that think science and data matters and we really need it to use it to talk
to our colleagues to show them the importance of it and to drive us in the decisions that we've
got to make." —Congresswoman Deborah Dingell"Achieving a clean, healthy Lake Erie will take hard work and investment by all levels of
government and non-governmental groups, as well as residents, all of us who live on the Great
Lakes who can make that positive impact. But we have got to have the critical information. And
this new Western Lake Erie Report Card is going to be valuable, critical, and helpful for
everyone involved that's dedicated to protecting Lake Erie and all of these most precious
waters. I mean, water is, it is our life. It is critical to all life." —Congresswoman Deborah Dingell
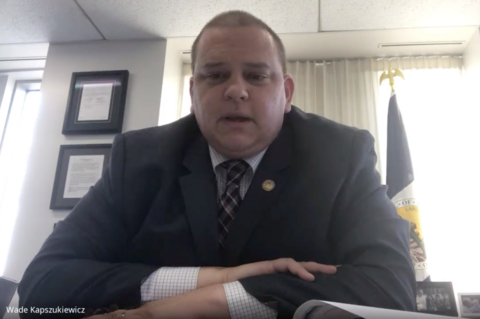
After Representative Dingell was the Mayor of Toledo, Wade Kapszukiewicz. Wade was a firecracker and had some great quotes.
"The science is so clear, the numbers are so clear. Everyone knows who is causing this problem. And there has been a political unwillingness to do anything about it. But that's why we advocate and that's why we fight." —Mayor Wade Kapszukiewicz
"Lake Erie provides more consumable fish than all of the other Great Lakes combined." —Mayor Wade Kapszukiewicz
"If we thought of the Great Lakes as it's own economy it would have the fourth largest GDP in the world. So you would think of it as an economy as strong as say Germany." —Mayor Wade Kapszukiewicz
"As often as this region has been derisively labelled over the years as the snow belt or the rust belt, I have long felt that we should call ourselves the water belt. Because this is where all the fresh water is. And this is where a huge percentage of all the water on the planet is." —Mayor Wade Kapszukiewicz
"By the end of this century water will have become the most valuable commodity on the earth." —Mayor Wade Kapszukiewicz
"The work that we have started here will certainly outlive us. None of us will be around in a hundred years, but hopefully the work we do to protect this resource does." —Mayor Wade Kapszukiewicz
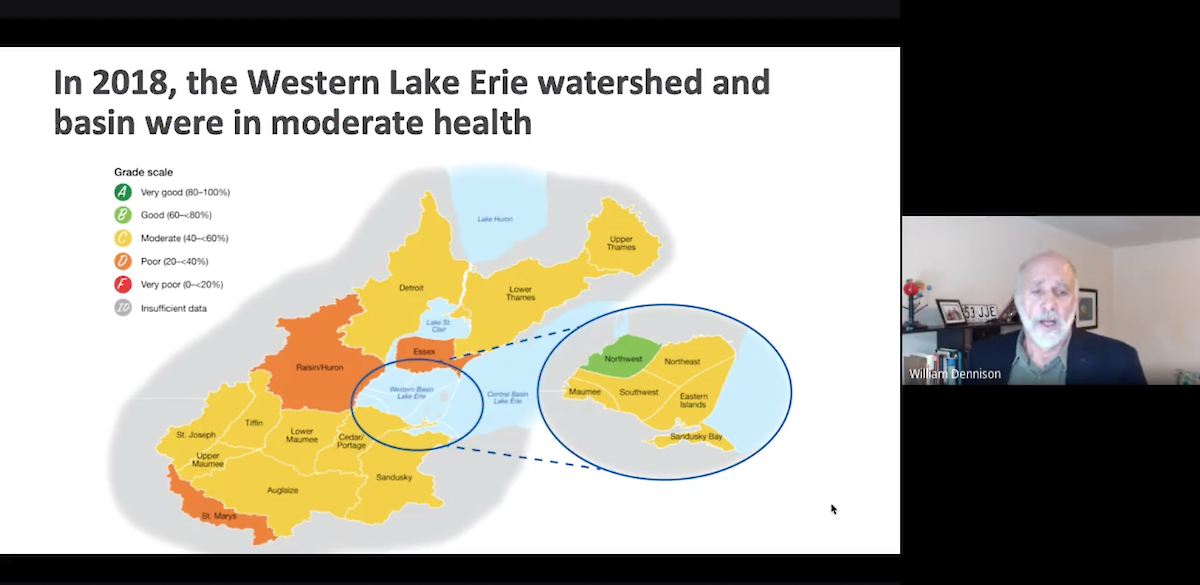
Bill presented the report card results.
Overall, the Western Lake Erie watershed and basin were found to be in moderate condition in 2018 with a mix of good and poor scores throughout the region. The Western Lake Erie basin scored 58%, a C+ grade, and the Western Lake Erie watershed scored 49%, a C grade. Ecosystem health is largely driven by harmful algal blooms, a significant and chronic problem that plagues Western Lake Erie.
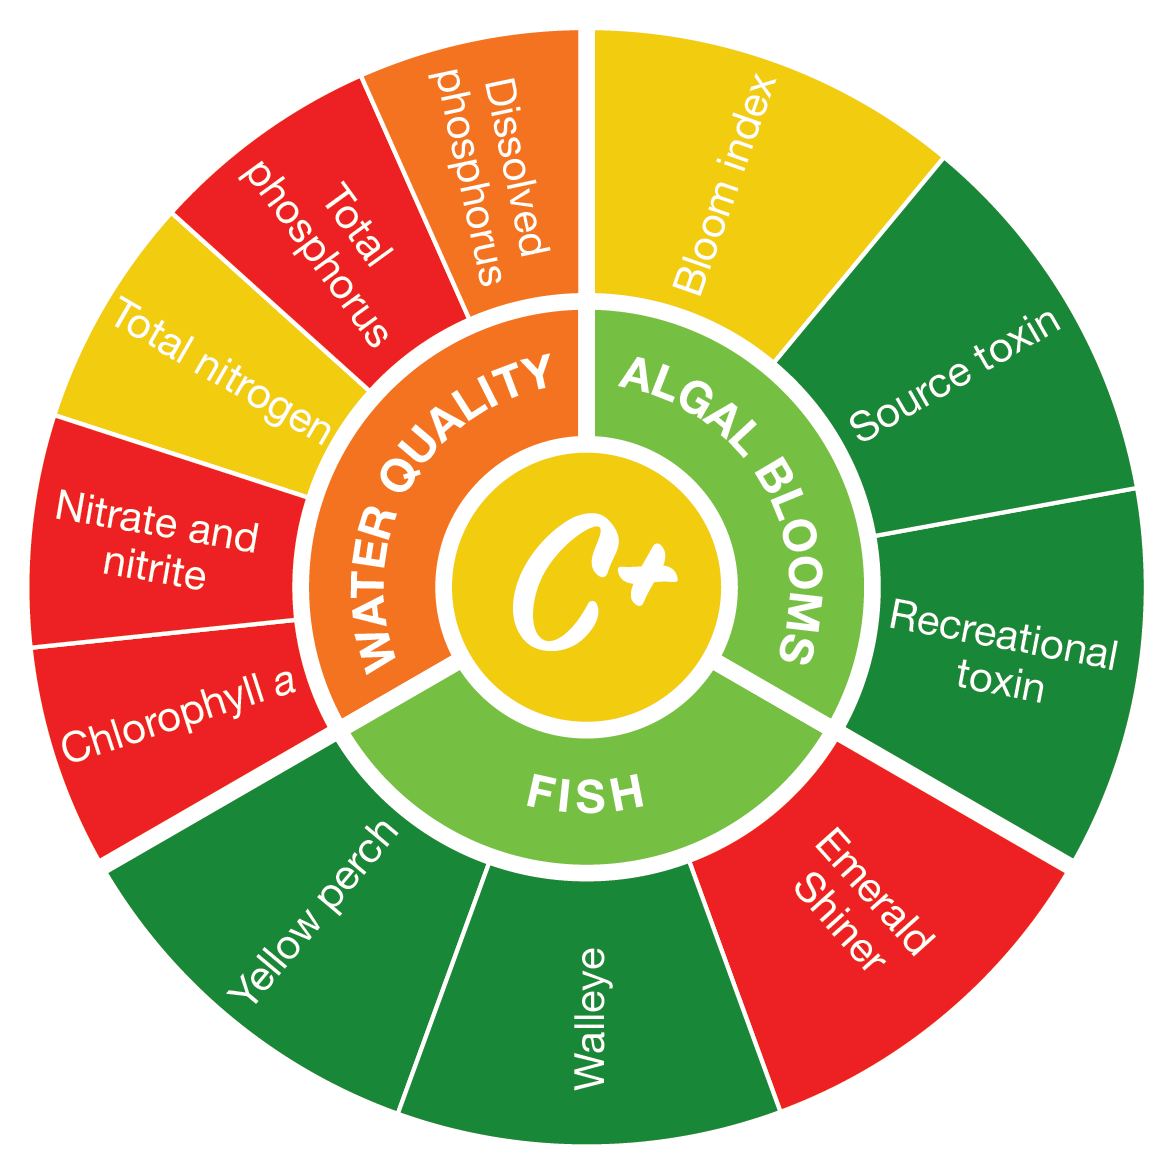
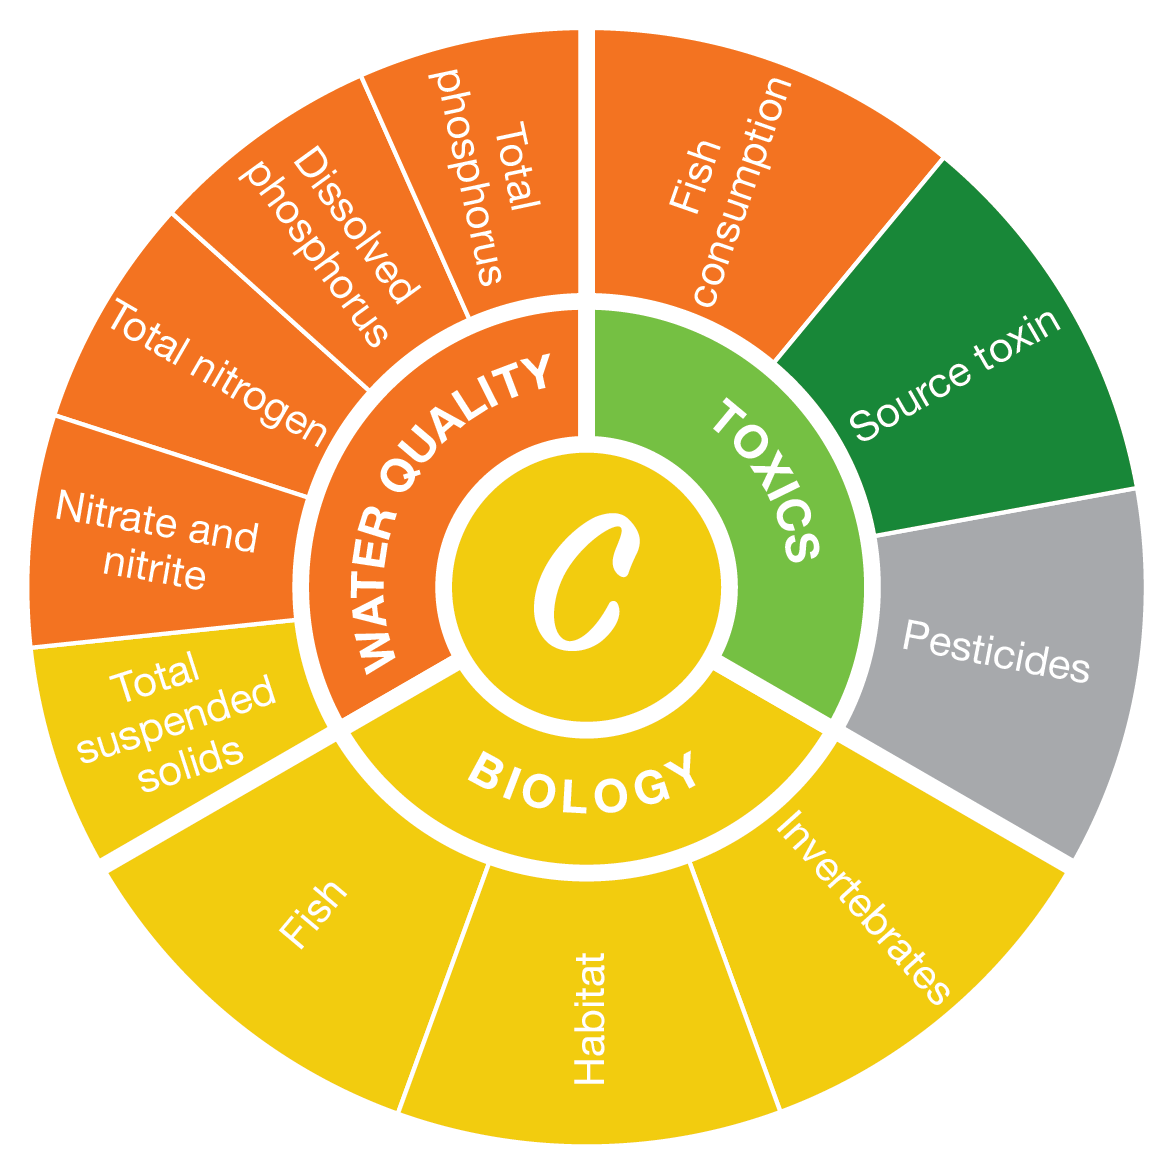

Next, Dr. Laura Johnson, the Director of the National Center for Water Quality Research at Heidelberg University, spoke about monitoring and data in Western Lake Erie. Heidelberg University has been monitoring the water quality of Western Lake Erie for 40 years and provided data for this report card.
"We always talk about blooms, but you know, Lake Erie does a lot for us. There's a lot of ecosystem services and there's a lot of threats to water quality aside from just blooms. So putting all of this together in one picture really helps people understand that we're not talking about one dead lake." —Dr. Laura Johnson
Finally, the last speaker was Dr. Tom Bridgeman from the University of Toledo Lake Erie Center, who spoke about the future of the report card.
"The University of Toledo will be able to lead the report card into the future and for as many years as the report card is needed. It would be great to think that someday we won't need a report card because the grade is always an A, but we're going to need a report card for many years to come." —Dr. Tom Bridgeman
"The report card will help keep us focused on improving the grade year after year." —Dr. Tom Bridgeman
Overall, the report card release was a great event. We were able to reach over 2 million people through traditional media and social media. The report card provides a synthesis of environmental status and gives stakeholders a key communication tool.
To see the report card document you can view or download the pdf.
To learn more about the data, methods, and process, visit the website.
You can see the event here: Watch on Facebook.
To see just the report card results portion: Watch on Youtube.
Photo credits:
All photos were provided by UMCES-IAN.